The development of Micro LEDs, quantum dot (QD) displays as a next generation displays following LCDs and OLEDs are becoming popular. By reducing the chip size to less than 100 µm and 10 nm levels compared to existing LEDs, with high-definition, high color saturation, fast response and high reliability, it‘s performance surpasses conventional LCDs and OLED displays. These devices are also ideal for new applications such as AR/VR/MR/SR, automotive head-up displays (HUDs), micro projectors, and smartwatches, which are expected to expand the market in the future. However, in the development process of Micro LED display, after the LED chips are arranged and assembled in the display module, optical performance such as wavelength, uniformity, in individual LED chips will be changed and different. It will directly affect the performance of the product. The following is an introduction to the quality inspection and measuring instruments of Micro LED during R&D, design and mass production.
PL Inspection and EL Inspection
PL inspection is the popular quality inspection of Micro LED die. However, PL inspection can only measure the state of the epitaxial layer of the LED die. It is impossible to accurately know the electric leakage of the die. Therefore, PL inspection is usually combined using with EL inspection. In general, EL inspection is a method for measuring the spectral spectrum and peak wavelength by installing an integrating sphere on the light emitting surface and measuring it using a spectrometer via optical fiber. However, it is difficult to align and takes a very long time to evaluate due to the smaller and smaller die size. LED makers and system makers test 2D measurement devices in order to solve this issue. For example, if more than hundreds of thousands of die on a wafer is inspected, the 2D spectroradiometer SR-5000 which can catch the spectrum, dominant wavelength and peak wavelength of many die in one shot, can be inspected in much shorter time than spot inspection using integral spheres.
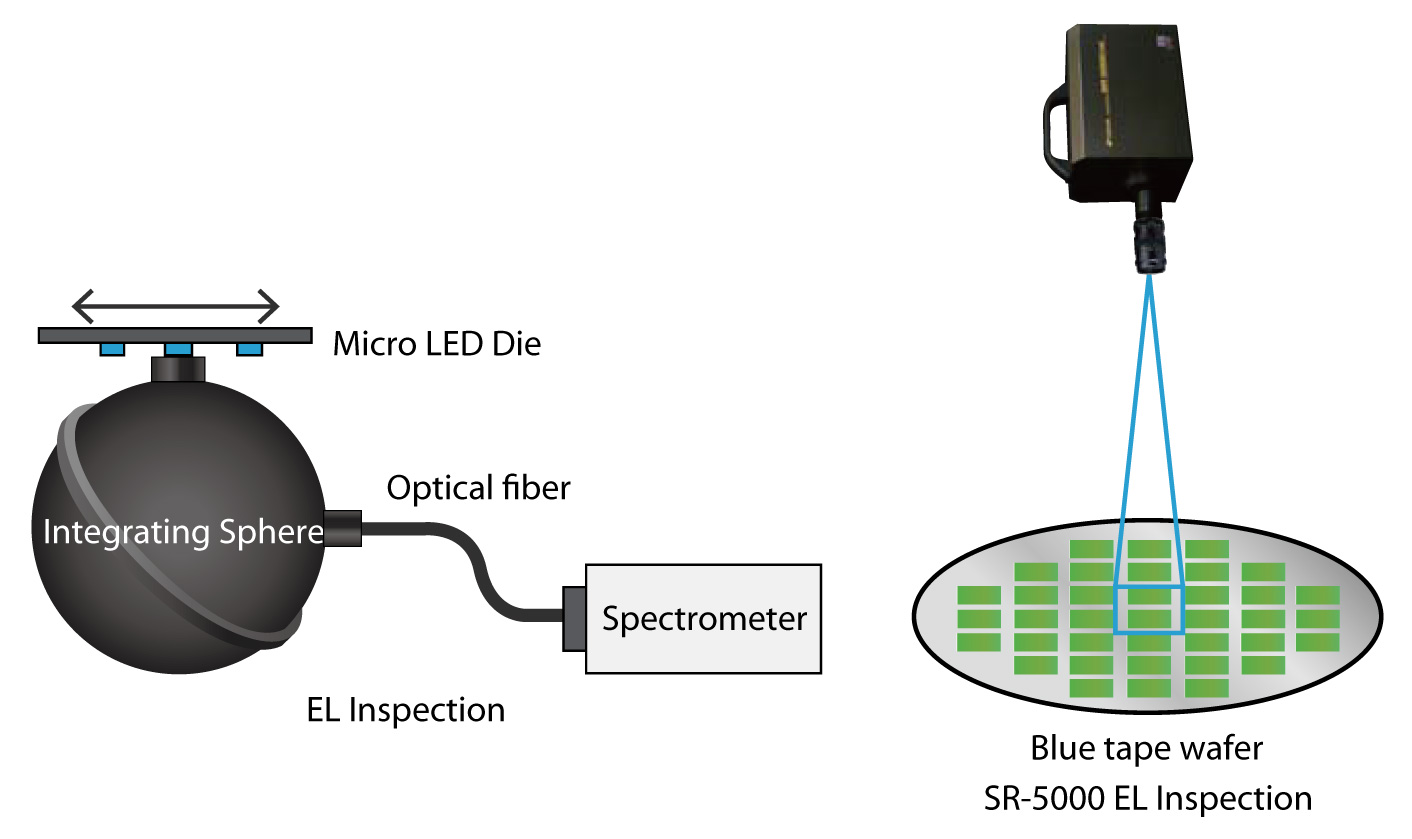
(Image: TOPCON)
Optical Quality Evaluation in Micro LED Display Module
After mass transfer, Micro LED chips are bonded to the backplane and processed into Micro LED display modules. There are mainly two types in Micro LED display modules. One is assembly type which use RGB chip, another is color conversion type which is blue color LED or UV-LED chip with QD or phosphor converting its wavelength to red or green color. The optical quality evaluation method of the module is mostly the same as the measurement methods of LCD and OLED display. The color meter or spectroradiometer are used as optical measurement devices to evaluate luminance, chromaticity and even spectrum.
In RGB assembly type display modules, each RGB LED chip has different currents, voltages, and response speeds, and is difficult to control. Luminance and color differences in sub-pixels (RGB LED chips) occur easier, especially color differences being a major problem. Therefore, it is important to evaluate dominant wavelength and peak wavelength when evaluating Micro LED quality. However, the traditional type spectroradiometer is spot type and is not efficient, because of one-by-one measurement and difficult alignment. Using the 2D spectroradiometer SR-5000, its macro lens type has a resolution below 10 μm. By widening the angle of view using a zoom lens, it is possible to check the emission status of the entire module with enough resolution. In addition, by using the automatic spot function, it is possible to catch each sub-pixel’s luminance, chromaticity and spectrum, to evaluate whether the performance of the sub-pixel brightness variation, due to the individual difference of the LED, affects the performance to the Micro LED display.
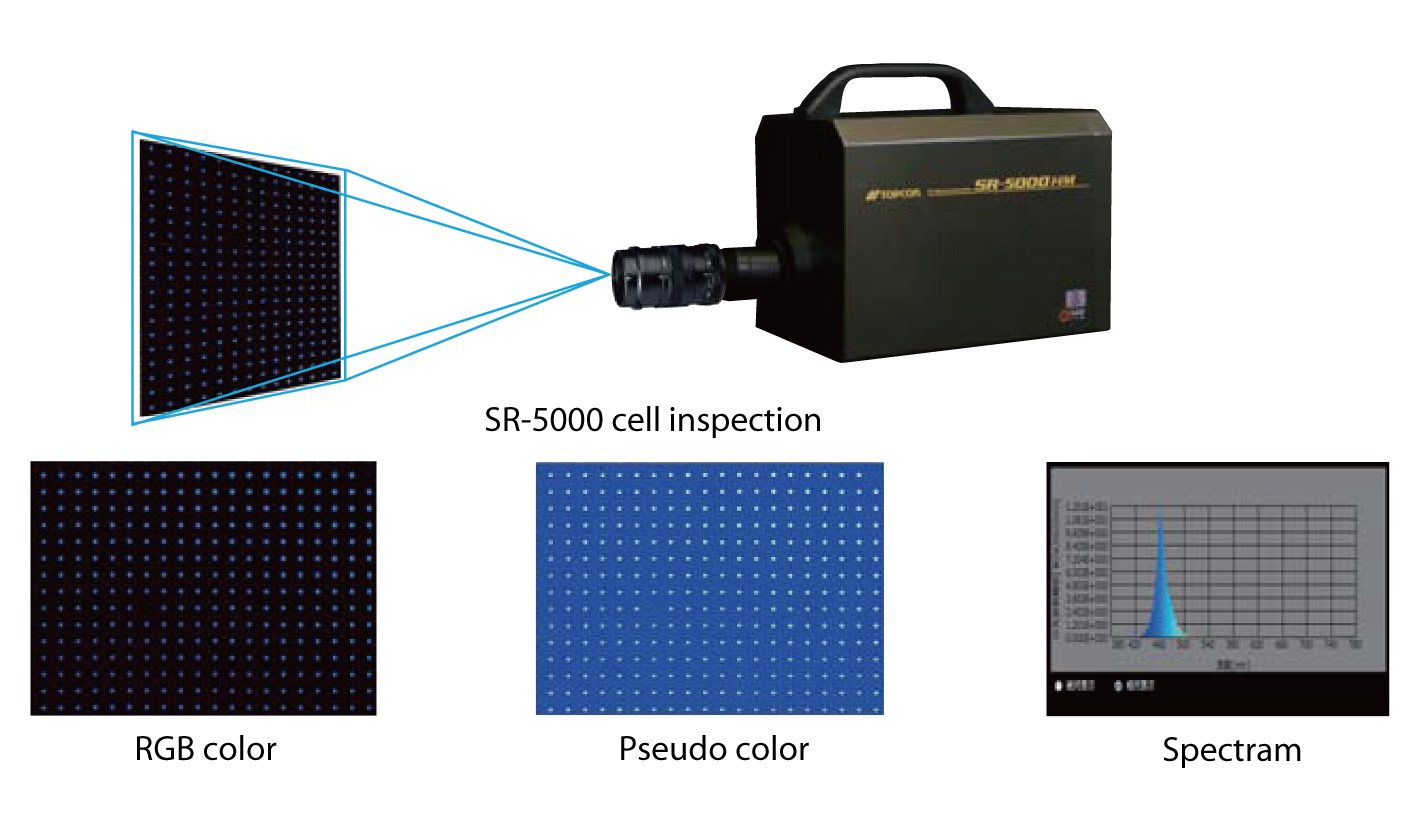
(Image: TOPCON)
With the color conversion type display module, it is easier to control the voltage and current between chips than in the RGB assembly type. However, when QD is used for the blue LED, blue light leaks through the gap between the particles of QD, so the output of blue light may be generated when G or R is emitted. This can cause color mixing and have a significant effect on the gamut. The mixed color caused by light leakage exists in some areas in the chip surface. However mixed color cannot be detected by the general CCD or XYZ filter type color meters. The 2D spectroradiometer SR-5000 combined with microscopes can measure for light leakage. An objective lens of a 20-magnification microscope can measure an area of 0.5 mm at 0.32 µm/Pixel, allowing for variation evaluation of luminance, chromaticity, and spectrum within sub-pixels.
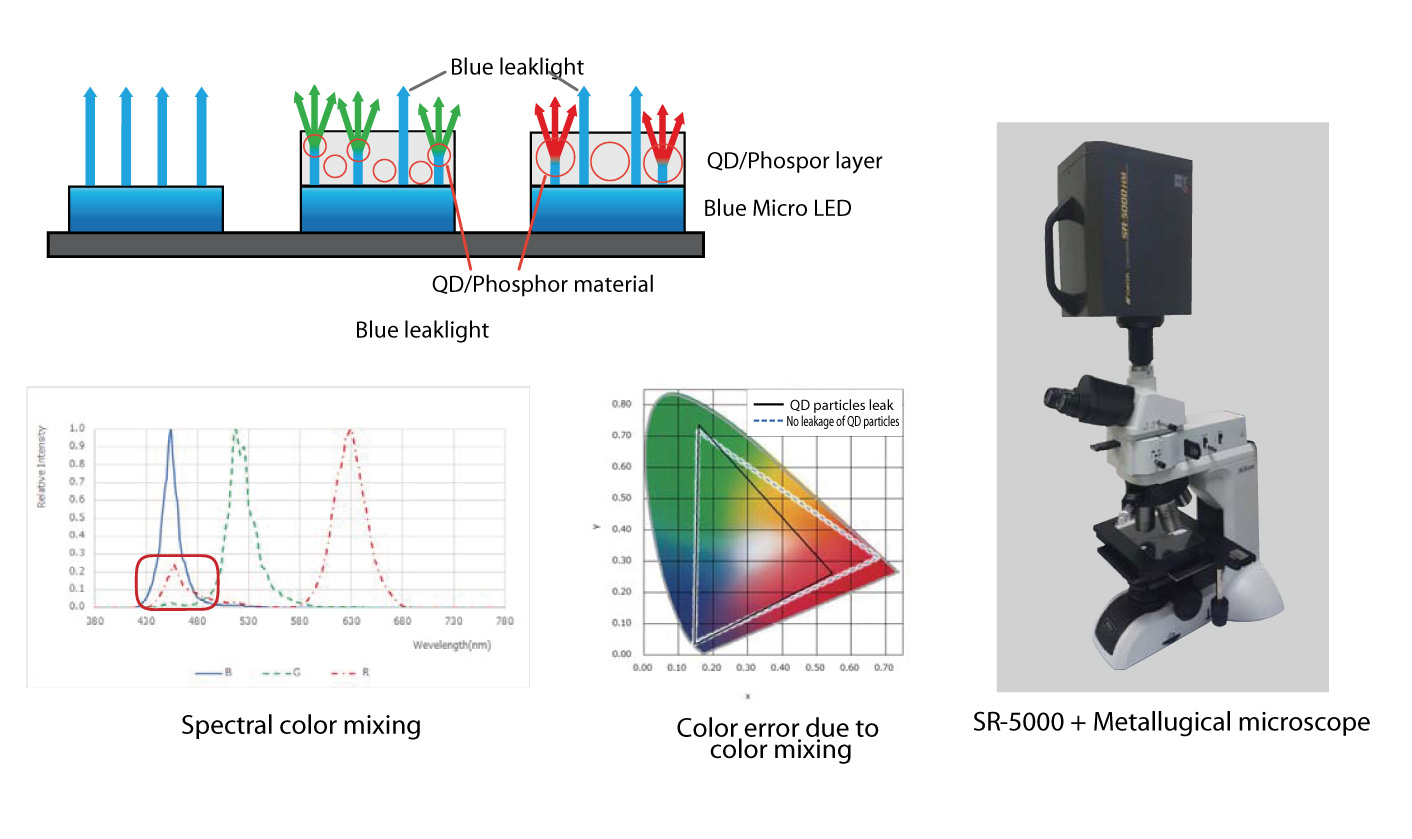
(Image: TOPCON)
(Article and images provided by TOPCON)
Join 2020 Micro LED Forum for more Micro LED technology progresses and market trend. Register and watch now!