The manufacturing process for LCD screens requires special attention to detail. Whether the LCD is used in TVs, mobile phones, computer displays, industrial instrument panels, avionics displays or outdoor signage, a single microscopic speck of contaminant can ruin the entire process. Impurities in the raw materials used, liquid crystals (LC), seriously affects product quality, life cycle and public safety. It’s a simple equation: lower yield means lost revenue.
The difference between displays from one LCD manufacturer to another can often be traced to the LC materials used and the impurity control level employed in the manufacturing process. To stay ahead of the completion, LCD makers constantly strive to improve product performance by minimizing degradation factors, controlling impurity levels in the LC materials, and exploring methods to develop new and better products.
LCD makers typically source LC materials from a mix of suppliers. To improve the performance of LCDs, some LCD manufacturers focus on enhancing their displays by changing the mixing method for different types of LC materials with base materials such as ester-based LC, biphenyl-based LC, and phenylcyclohexane-based LC.
There are five areas where LCD makers can significantly improve the overall process control in their R&D labs:
-
Voltage: Reduce electricity consumption by decreasing the driving voltage.
-
Temperature: Expand the stable-working temperature, ranging from low to high temperature.
-
Viscosity: Improve the response speed applicable to video.
-
Refractive index: Control colors and obtain bright white.
-
Elasticity: Improve the orientation features of LC molecules when an AC voltage is applied to yield higher contrast.
But decisions on which quality control methods are used largely depend on the intended purpose of the LC materials. Most manufacturers rely on high performance liquid chromatography (HPLC) and gas chromatography (GC) for quality control and analysis of LC materials. Both HPLC and GC, however, have their own shortcomings when running accelerated degradation tests.
For instance, although the column is a key component for separation, limited types of columns are available in GC due to the boiling point of materials and other limiting factors such as stability of liquid phase in capillary column. GC also has limitations, especially for isomer separation to make LCD displays. In HPLC, on the other hand, the separating capability is inferior to GC, and the possible overlooking of micro-components is a concern. This means relying solely on HPLC is insufficient to ensure impurity control levels are maintained at the highest possible levels to stay ahead of competitors. If impurity and degradation component are identified and the way to control them is established at pilot study, defective ratio will be improved at least more than 10% on commercial size display and further improved on larger size display.
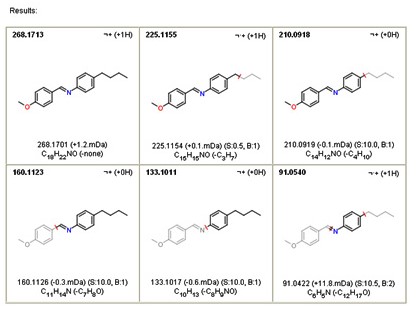
The combination of advanced technology with high separation capability, a UPLC and a high-resolution mass spectrometer allows for high-quality separation analysis of LC materials. UPLC technology allows for the separation of several major LC materials in a short time, with micro-components as well. Additionally, in quadrupole with a time-of-flight mass spectrometer (Tof-MS) — characterized by comprehensive and high-sensitivity detection — the factors that vary minutely between pre- and post-accelerated degradation tests can easily and visually be identified, and the information related to the composition of these factors is able to be acquired. In product ion spectra, the components of fragment structure (product ions) can be analyzed, the structure can be predicted, and the predicted structure can be verified using MassFragment software.
-
Accelerated degradation test using UV irradiation – Identify the cause of deterioration by comparing by-products and additive consumption in polarizer and UV cutting film between cycle test for safety and life cycle.
-
Accelerated degradation test by heating – Identify the cause of deterioration by comparing by-products, color resist, additive in LC, polarizer and color filter between cycle test for safety and quality.
-
Tests related to electrical resistance – Identify the cause of deterioration by comparing by-products of LC between cycle tests for longer life cycle.
Fragmentation prediction software in action
The predicted structure in an MS/MS spectrum can be verified using the MassFragment software. If there are contradictions in the fragment structural assignment from the predicted structure, the position of functional groups or other structural groups as well as the frame are reviewed and corrected, and verification using MassFragment is conducted again.
 |
|
(Results Source: Waters Corporation) |
Contamination control and ensuring manufacturing process standards are maintained is critical for LCD makers to maintain yields. Deploying the latest separation technologies and instrument analysis makes it possible to tackle the challenge of efficiently and economically producing increasingly complex displays. For LCD makers, strong quality assessment plays an indispensable role in running a profitable business.
(The article is written by Nobutake Sato, Chemical Materials Market Development Manager, Asia Pacific, Waters Corporation.)


