 |
Source: U.S. Energy Information Administration, August 2014 Electric Power Monthly
Note: Data are preliminary.
Note: Map of U.S. Census divisions. |
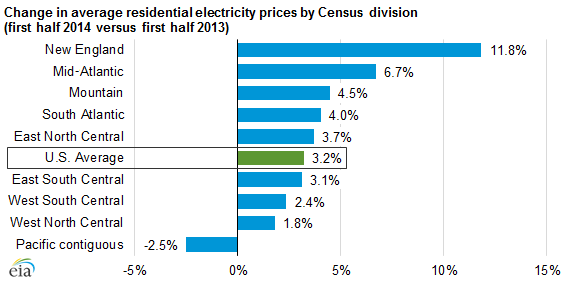
U.S. retail residential electricity prices for the first half of 2014 averaged 12.3 cents per kilowatthour, an increase of 3.2 percent from the same period last year. This is the highest year-over-year growth in residential prices for the first half of the year since 2009. Average prices rose in all areas of the country except for the Pacific Census Division (excluding Alaska and Hawaii).
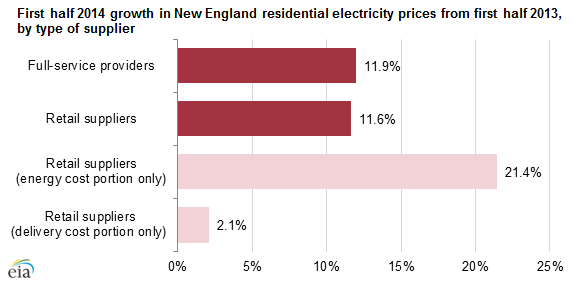
Electricity customers in New England experienced the largest price increases, averaging 11.8 percent. Beyond taxes, fees, and other charges, there are two main components of electricity bills: the generation component, which reflects the costs of generating the electricity, and the delivery portion, which reflects the costs of transmitting and distributing that electricity. All New England states, with the exception of Vermont, have restructured the industry so that residential customers have the option of choosing an alternative retail electricity supplier for the generation (energy) component of their electricity bill. More than one-quarter of all residential customers in New England pay a retail supplier other than the regulated utility for the generation of their electricity. Customers of both full-service utilities and restructured retail suppliers have experienced similar rate increases of just under 12 percent so far this year.
 |
Source: U.S. Energy Information Administration, Form EIA-826 survey
Note: Growth rates reflect preliminary data. |
The primary driver of the recent increase in New England retail rates was the sharp rise in wholesale power prices. For the first six months of 2014, the day-ahead wholesale power price in the ISO-New England control area averaged US $93 per megawatt hour, 45 percent higher than the average wholesale price during the same period last year. The increased cost of producing electricity in New England is evident in the 21 percent increase in the energy-only component of restructured retail suppliers' rates. In contrast, the delivery-only component of restructured retail customers' bills has risen only 2 percent this year. This component of electricity prices has been rising in part because utilities have been spending more on the transmission infrastructure necessary for delivering electricity to customers.
The 2.5 percent year-to-date decline in Pacific residential electricity prices is distorted by a temporary dip in revenues for California utilities during the month of April. This drop was a result of a credit averaging about US $35 to the electric bills of most customers of the state's investor-owned utilities. The California Climate Credit is a refund of money that the state receives from the sale of allowances for greenhouse gas emissions through their cap-and-trade system. Excluding the month of April when the refund was issued, prices paid by residential customers in the Pacific region rose 0.9 percent above the same period last year. In California alone, prices (excluding April) were 1 percent higher.
How does EIA calculate retail electricity prices?
Electricity prices can be difficult to determine, as they depend on the customer's rate structure, which can differ greatly from company to company. EIA does not directly collect retail electricity rates or utility tariffs. However, using data collected on revenues and kilowatt hours sold to each customer group (residential, commercial, and industrial), EIA calculates average retail revenue per kilowatt hour as a proxy for retail electricity prices. The Utility Rate Database, sponsored in part by the U.S. Department of Energy, is one useful source of rate structure information.


 CN
TW
EN


